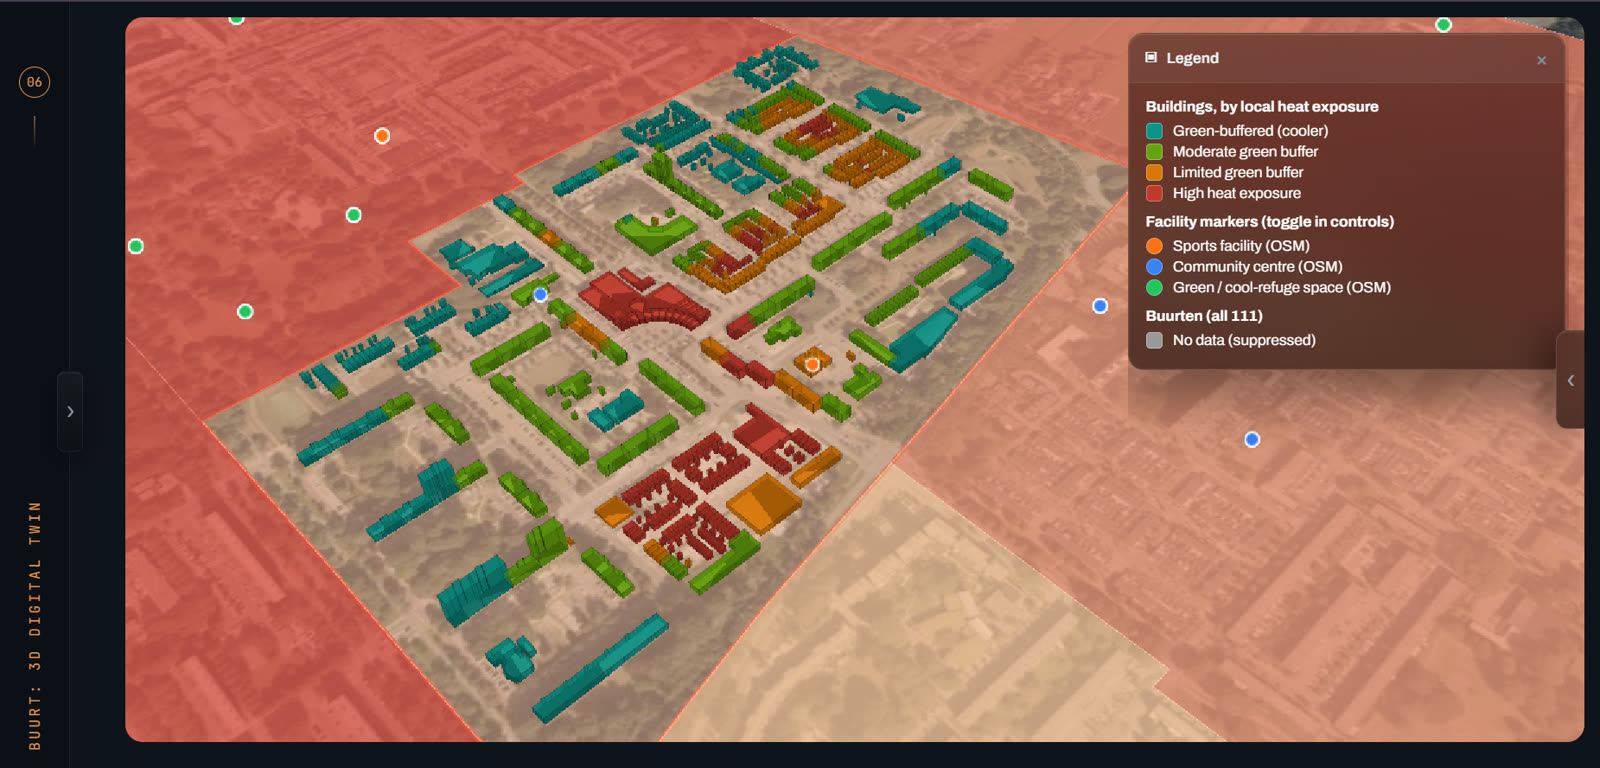
A digital twin of a real Utrecht neighbourhood, built from real data. Scroll to watch it come together: scan, model, measure, decide. Then take over and explore it yourself.
Official BAG footprints and 3D BAG heights rebuild Terwijde-Oost, 1,702 buildings, from the point cloud up.
03 · MEASURE
Heat, measured around each one.
Landsat 8/9 land surface temperature, averaged in a 25 m buffer around every footprint. Surface temperature, never mixed with air temperature.
04 · DECIDE
Where help should land first.
The hottest clusters stand out. Across Utrecht the same method scores 111 buurten on 28 indicators, so a safety region can rank where to act before the calls start.
05 · EXPLORE
Now it is yours.
Drag to rotate. Click a building to fly to it and read its numbers. Switch between heat, greenery, height and priority on the right, or change district.
Scroll
District
Layer
Building
Hover or tap a building to inspect it.
The second twin · Rijnland
Where do we look first?
Noordeind- en Geerpolder, 4.7 km² of real watercourses, lakes, pumps and weirs from Rijnland's registers. Switch layers, inspect a structure, and step through six years of lab readings from the two stations that have a record. Only 2 of 87 registry stations do, which is the whole problem.
Real Rijnland data. Flow layer is illustrative only.
Lab readings
“Unusual” = outside 1.5 × IQR of that station's own history (Tukey fence). It means statistically far from its own record, not polluted.
Selected
Hover a structure or station.
The interactive 3D views load data files, so they need the hosted page. Open the published site to explore.
The decisions
From insight to action.
One method for every scale: source real data, score it with a method written down, put it in 3D so anyone can click a building and see why, and say plainly what it cannot tell you.
01 · Veiligheidsregio Utrecht · Jun–Sep 2026
Which neighbourhood needs help first in a heatwave?
A heatwave lands on people who are old, alone, or under a roof with no shade. The Heat Resilience Digital Twin scores all 111 Utrecht buurten on 28 weighted indicators, ranks 11 candidate wijken, then drops to street level: every building at its real height, classified by Landsat heat measured around it.
111buurten scored
28weighted indicators
2,608real 3D buildings
+2.5 °Chottest class vs rest, on unseen Landsat data
Where do we look first when a discharge is suspected?
Rijnland samples at few places, weekly to monthly at best, so nobody can say where something started. The Langeraar Water Quality Digital Twin ranks buildings and structures that are plausible places to start looking and compares the stations that have a real lab record. A screening tool, not proof of a source.
One buildingA neighbourhoodA city of 111 buurtenA polderA region
How it works
From open data to a handover in five steps.
01
Source
CBS, RIVM, KNMI, Landsat, BAG, 3D BAG and agency registers, each with its origin recorded.
02
Model
A written scoring method per decision. Weights, directions and cut-offs are explicit.
03
Twin
Put it in 3D so a non-specialist can click a building and see why it scores as it does.
04
Decide
Rank where to act first, with limits stated next to every number.
05
Hand over
Method report, guide, walkthrough film and a session with the team who will use it.
↻ Learn & improve: new data shows what to refine next
Built from data. Defensible by design.
01
Every figure is real
Nothing is sample data. Each layer carries its source, date and what it compares.
02
Screening, not proof
Scores are signals from public data. Grey means “not evaluated”, never “safe”.
03
Missing shown as missing
Where CBS or RIVM suppress a value, the map says so instead of drawing a zero.
04
Surface is not air
Land surface temperature is labelled as such and never mixed with air temperature.
05
Open standards
BAG, CBS, PDOK, KNMI and GeoPackage, so the work travels between tools and teams.
06
Handed over, not left behind
The VRU twin went to the resilience team and the OKT-P programme with documentation.
Films & screens
See them move.
Heat Resilience Digital Twin, launch film.Langeraar Water Quality Digital Twin, teaser.
Heat Resilience Digital Twin
Zambesidreef in the full Cesium twin.Terwijde-Oost with live KNMI air temperature.One resilience score per buurt.Eleven candidate wijken, re-rankable.111 buurten by indicator category.
Langeraar Water Quality Digital Twin
The full Cesium twin.Discharge-source screening tiers.Inspect one building: how its number was reached.Water quality tint on lakes.Station comparison by date.Candidate areas and nearest evidence together.
Next
Tell me the decision you have to make.
I am looking for my next internship or role, six months or longer, building digital twins and spatial decision tools. The VRU source code is private internship work, but I am happy to walk through it on request.